A Growth Culture: Enhanced with Behavior Analytics
Posted by Frederic Lucas-Conwell
A Growth Culture: Enhanced with Behavior Analytics
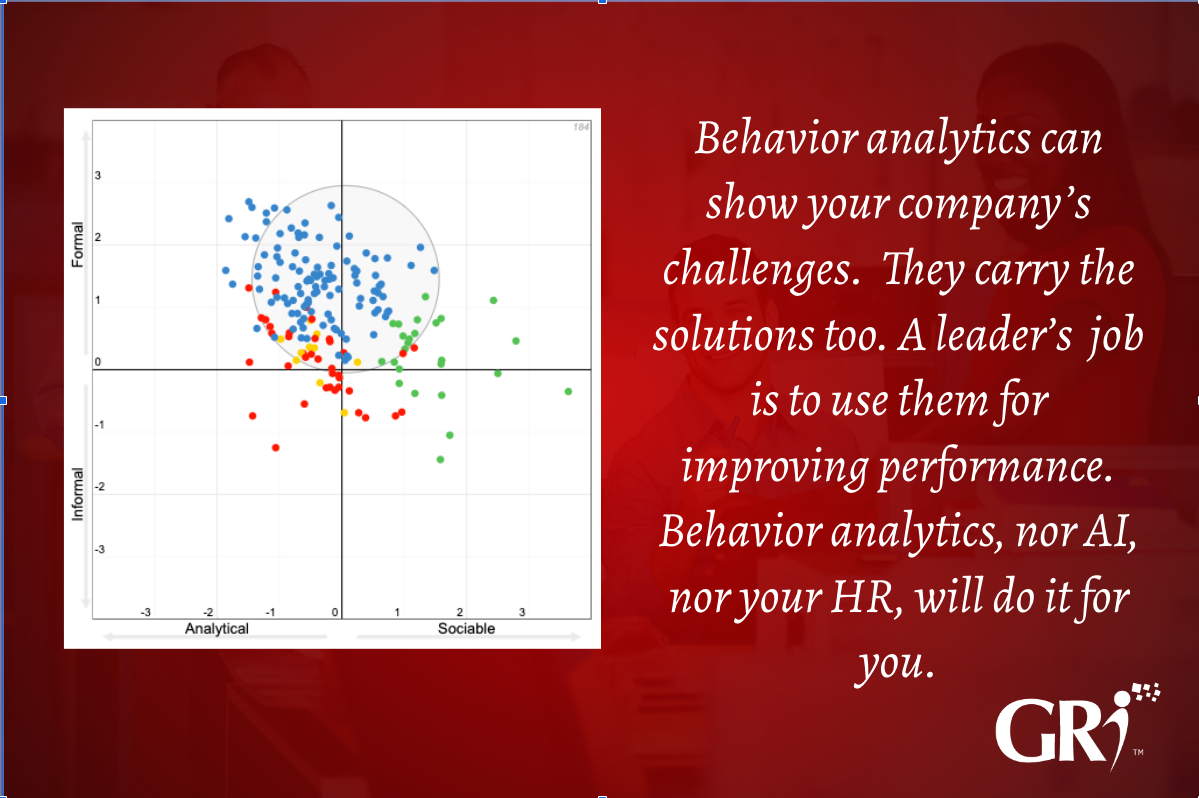
People are often amazed by how much we can learn from a behavior distribution map such as the one below.

You may have guessed that the little dots represent people. The two axes, Informal/Formal and Analytical/Sociable, are two behavior factors among the four we measure at GRI, and along which people’s behaviors are plotted. The colors tell about the primary factor of each person(1).
Looking at this map is like observing people at 15,000 feet: some dots over time get closer to each other, some fast, others stay still. New ones show up, others disappear. There is constant movement and change. Analyzing from above with other lenses—that is, other information collected on individuals—will bring additional perspectives.
This map shows 184 HR team members at a large company of more than 200,000 employees, which was growing fast at the time the behavior profiles were collected and the map was drawn. In the eight years that followed, its size almost doubled.
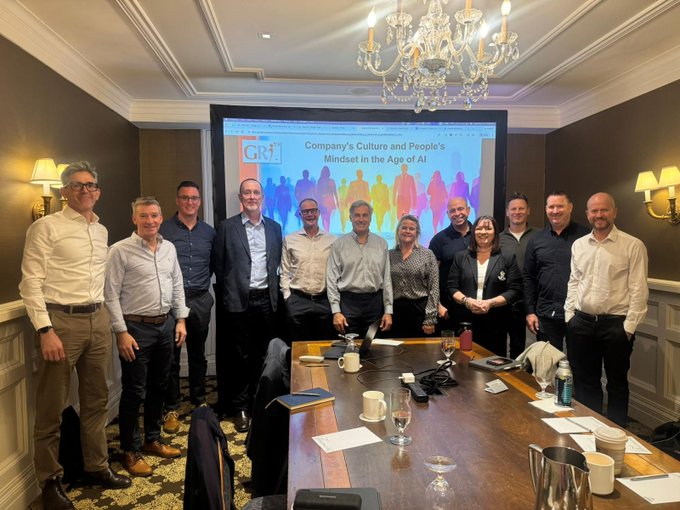
During our recent forum at GRI on growth culture, discussion from articles on “growth-oriented mindset”, “a learning culture”, “innovation,” and others (2) brought insights into how organizations can leverage growth. Group analytics is part of that discussion. It shows potential issues and remedies that cannot be seen otherwise. What follows are some lessons derived from the above example, and others that we have been fortunate to analyze and work with over the years, with and without AI.
Issues and Remedies Are in the Data
It must be said upfront that a lot of data can be collected on people, including from social media, surveys, and more. Data in the workplace is aimed at helping people perform in teams and recruiting them while improving their well-being. Data used for clinical applications, that does not comply with data protection standards, is irrelevant. The data we are dealing with here with GRI is predictive of a person’s behavior and is work-related.
The data plotted on the above map comes from GRI’s behavior-factor-based approach, and its 2-question survey. A behavior profile is drawn from the survey, accurately informing how people act, think about it, and adapt in a way that may be engaging or not. The visual representation of the profile makes it easy to learn and use.
Often the first step in working with this data is getting confident in what it tells about you that you couldn’t know otherwise. You have your own experience of yourself, of course, and in managing people. A lot of systems exist on the market with which this data competes. Experiencing the data on yourself starts making it relevant not just for you but also for others who will be in a different place from a behavioral and emotional standpoint.
If you are plotted on the map, you may be curious about how others compare to you. If that’s the case, ask what’s the practical relevance of making this comparison. Besides curiosity, what are your objectives, and what are you looking to accomplish with the data?
From our observations and knowledge gained in HR teams, we can draw some solid conclusions from the above map. People showing in the bottom left quadrant will have a harder time than all others on top or on the right. As a matter of fact, all the people in the bottom left progressively quit their jobs faster than others. This could have been expected and avoided.
Strongly adapting behavior—as was the case of those in the Analytical/Informal quadrant above— doesn’t really happen, or not in any reasonable way. It creates frustration and disengagement (3). The more distant they are on the informal side of the Formal/Informal scale, the more easily they would leave. The more distant they would be on the upper side of the formal scale, the more they would stick to the job.
This understanding at group and individual levels can be followed up with corrective actions if you, as a leader, 1) trust the data and outcomes, and 2) are accountable for those outcomes.
The data from the map not only shows the issues described for the HR team. It also brings the solution: how the issues can be solved by more accurately understanding people’s behavior and the real nature of the job.
If you are the leader of a team, you may want to prevent negative outcomes from happening in the team. Your own behavioral profile informs on how this will most probably happen, and looking at others on the map, how they will most probably respond. The key word in all the above is HOW: what’s in the team’s map and the individual profiles from a behavioral standpoint is.
The same applies to teams other than HR. Whether it is accounting, sales, legal, or production, some behaviors are typically expressed in some jobs more than others. Some teams like these need to be more homogeneous. Others, like executive teams and boards of directors, tend to require a diversity of behavior profiles.
In all cases, the behavior data contains the potential issues at stake but also the remedies to apply. It requires the leader's knowledge and abilities to not only implement some recommendations but also to adjust their own behavior and managerial skills, as informed by the data.
Recruit People from a Behavioral Standpoint
Recruiting candidates using a behavior map, as above, provides several advantages, including during times of high growth. It broadens your pool of applicants; Your applicants are more in target with your search; You spend more time with the good candidates, and less with the not-so-good ones; You can reduce the number of interviews; You can start building trust with future employees upfront, during the interview, better “sell the job” to the good candidates, and accelerate the onboarding.
Some speak about personality traits. We at GRI refer to “behavior factors”. Personality is a broad concept, used by clinicians as well, and for a different purpose than what we do in organizations. Executive coaches generally use typologies rather than traits. However typologies are inaccurate and cannot show their lack of adverse impact on protected employees. They are never used in recruitment. Personality traits, although used in recruitment, lack accuracy as well (4).
On the other hand, behavior factors, once combined into a behavior profile, can help make accurate behavior predictions about people, because the data also applies to jobs, not just people. For our above case in HR, the behavior request in the job is represented by a circle along the two axes Informal/Formal and Analytical/Sociable.
There are generally two typical behavior profiles for HR jobs. One leans toward people administration, including the legal, compensation, and benefits aspects. It involves less frequent contact with people: numbers come first. The other one leans toward the people and leadership development aspects, with the opposite tendency toward people and numbers: people come first (5).
Those two tendencies show in the above map with the green dots on the upper right quadrant, and the blue dots on the left. Eventually, those two types of jobs within the HR team need to be plotted separately, indicating who is inclined to switch jobs; something again that doesn’t show intuitively but becomes obvious when knowing the data and looking at the map.
The same applies to other jobs. Overall, a better fit between people and job requirements reduces people turnover and increases engagement. Candidates can be more effectively attracted, screened, interviewed, and onboarded.
Mapping candidates with behavior analytics at the different stages of recruitment helps to evidence what may have gone wrong and take corrective actions.
Avoid Unnecessary Conflicts in Teams
Conflicts in organizations are inevitable. Biases of all kinds are ubiquitous. Misunderstandings constantly happen. Small things may bother and irritate some. Saying too little or too much can be judged. There are an infinite number of reasons that cause people to get into conflict within a team and the rest of the organization. The uncertainty, permanent disruptions, and chaos that come with high-growth cultures exacerbate potential conflicts.
Potential conflicts are informed by how we are prone to spontaneously create them as well, act and react to them, as they show in behavior profiles at an individual level.
At a 15,000-foot distance, the map helps see the general tendency for absorbing conflict or creating friction, and how everyone generally deals with it. Like with Google Maps for navigating the landscape, behavior maps help you zoom in on particular details and out for a general trend. One specific person or relationship may require special attention. Clicking on the dots brings the details needed for understanding the specific case and finding remedies.
How one learns and grows from conflicts is informed by one’s behavior profile. An in-depth analysis of the profile provides specific and accurate solutions to conflicts. The map helps to take some distance with potential conflicts, to consider how people complement each other, and to prevent and resolve conflicts at a group level by taking into consideration the job demand as well.
As in the above HR team, the circle represents the targeted behavior for the team. It serves as an indicator of what works best for all from a behavior standpoint, as should have been agreed upon by the management. How one may adapt to the job will be influenced by the relationships at work, among which leadership and management play a crucial role.
Conflicts can be looked at as opportunities for personal development. Again, the potential conflicts and remedies are in the same behavior data. A holistic understanding of people shows how they work as a team, how the relationship with their leader can enhance their performance, and how they adapt to their job’s demands. Here again, the keyword is HOW.
Apply Behavior Data for Sustainable Growth
Behavior analytics are precious resources in a growth culture where recruitment happens frequently. They help to broaden the pool of candidates, be more specific, and onboard candidates more effectively. The proverbial “the right person in the right place” is easier to say than to implement. It requires looking at a job demand as well, not just candidates. Being able to aggregate all behavioral data helps to refine how candidates get attracted and funneled through the recruitment process.
Conflicts can be anticipated and dealt with more effectively. Behavior data provides the remedies, not just the indication of potential frictions. The mapping of behavioral data at the group level provides general trends that need to be zoomed in on people and relationships. Leaders and managers to be proactive with this data. They can expect AI and smart analytics to facilitate their job, not to do it for them.
All aspects of recruitment and management can be anticipated and dealt with more efficiently once the behavior data is put into action by the management and even the future employees themselves when they receive feedback on their results and get the chance to be more accountable for their performance with them.
As for maps of landscapes, behavior maps are just maps. They can be useful once their lessons can be put into action by leaders and managers who are driving the landscape, making the decisions, and executing them with their teams.
Notes and References
(1) GRI measures four behavior factors that combine into a behavior profile represented by three graphs (the Natural, Role, and Effective), each of them containing four points (the factors) connected by lines. The profile enables a nuanced analysis of a person’s natural way of behaving (Natural), adapting to the environment (Role) that ends up in observable behaviors (the Effective).
(2) Articles on growth culture:
- Choosing to Grow. The Leader’s Perspective. McKinsey. July 2022.
- Creating a Culture of Learning and Growth. Harvard Business Review. March 2022.
- Winning Today’s Race While Running Tomorrow. PWC. January 2023.
(3) It refers here to Engagement as it is measured by the GRI. There are a lot of surveys that measure people’s engagement. GRI measures it with connection to people’s behavioral makeup and job demands.
(4) That is to comply with the Equal Employment Opportunity Commission (EEOC) Guidelines, as well as the professional standards established by the American Psychological Association (APA) and the Society of Industrial & Organizational Psychology (SIOP).
(5) This shouldn’t come as a surprise. Our data and observation corroborate other findings on HR jobs, including those of Dave Ulrich. See for instance: Ulrich, D. (2005). The HR Value proposition. Boston : Harvard Business School Press.
The article was written by Frederic Lucas-Conwell, with editorial work from Nicole Phelon, following a GRI forum on Growth Culture. Particular thanks to Mihai Moghior, and Jean Michel Lorenzi for their contribution.
Frederic Lucas-Conwell is CEO & Co-Founder of GRI – the Growth Resources Institute. Frederic is an author, researcher, speaker, and serial entrepreneur for the last 35 years. He has consulted for Fortune 500, privately-held companies, and startups, in leadership and organizational development. Frederic holds a Ph.D.in Organizational Behavior from Paris Dauphine University - PSL.
Please contact us today at contact@gri.co to learn more about how the GRI can work for you and your company. To receive our newsletter, subscribe here.
Latest Articles
Fasten Your Seatbelt: Organizational Change with AI Continues to Accelerate
Organizational transformation projects have historically faced high failure rates, a challenge that is intensifying as the democratization of AI accelerates the pace of change,...
Groupama Successful Transformation in Romania: The GRI, Catalyst for Profound Change
The history of Groupama in Romania is an eloquent testament to resilience, strategic vision, and the transformative impact of innovative management tools. Arriving at the...
Hybrid Work: A Management Revolution
The COVID-19 pandemic has acted as an unprecedented catalyst, radically transforming our approach to work. What was once a marginal practice has become the norm for many...